
Making my own map (Object-based imagery analysis of remotely sensed data)
One of the barriers I have encountered in my field research is not being able to find a statewide map of the green infrastructure that I am studying. However, the satellite and airborne imagery is available for me to use to make my own map of the detention basins of New Jersey. In addition to plants, I also love maps. One of the major themes of ecology is patterns on the land, and I am investigating biogeography at different scales. At Rutgers, I have earned a Geospatial Information certificate as part of my coursework. So, as I am a budding geographer, I want to use geospatial methods to support my fieldwork. I made a preliminary attempt to classify basins in one town. It was semi-effective, if crude:
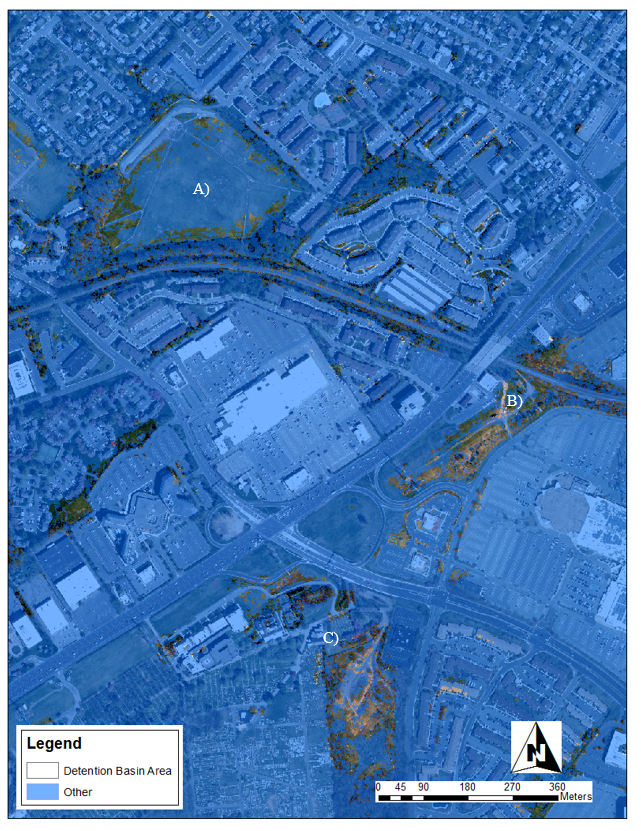
Detail of a test map classifying stormwater detention basins. A), B), and C) are detention basins that were correctly classified (partially).
In order to make a better map, I looked into the current best classification techniques. “Object-based image analysis” is the current paradigm in classifying remotely sensed imagery. Here are the basics of what I found out:
“Objects” can include human-made objects with distinct boundaries, such as buildings, cars, or roads or landscape objects with vague boundaries, such as forest and wetland patches. “Remote sensing” refers to the capture of data and imagery by satellite, airplane, drone. There is an enormous amount of remotely sensed data, but to be useful, the data must be translated into relevant information. One way that remotely sensed imagery is often used is to create maps of land cover classes, such as water, forest, sand, urban, etc. Newer classification methods group contiguous pixels of similar properties and include context, shape, and statistics in creating the categories.
A basic problem of classifying images into categories is that categories of interest to us as human beings do not necessarily have a 1:1 correspondence with physical. For example, a soccer field and an agricultural field may look very similar in a satellite image in terms of shape and color, but to people, they are very different. Another challenge is that remote sensing data is captured in raster format, which is a grid of pixels. Pixels are usually square, and their dimensions are arbitrary with respect to target objects. Pixels are inconvenient for delineating irregularly shaped objects, such as most natural forms on Earth. Originally, pixel color or value was the main way of classifying categories on Earth’s surface. Pixels of similar values throughout an image were classified together as one category.
Per-pixel classification was appropriate for earlier remote sensing technology because pixel sizes were larger than objects of interest on the ground. Many satellites, especially older ones, had pixel size that ranged from 30 m all the way up to 1 km on the ground. At that size, a pixel could be simply assigned to the general land type that it covered, as discriminating fine detail was impossible. Current technology allows much smaller pixels, as small as 1 cm. At that size, the pixel is smaller than objects of interest, such as roads, or individual trees, so groups of pixels are now more relevant than individual pixels.
When using this new, high-resolution data with small pixels, pixel-based classification methods have low accuracy for identifying urban land-cover classes. Different urban land covers may have similar colors yet be of different types. For example, cement roads, sidewalks, parking lots, and rooves are all the same color in images and would be lumped together if you were only using pixel color as a guide. The opposite situation, when an object is multi-colored, is also a challenge for single pixel classification. For example, a river can contain clear water, but it can also contain cloudy water or shallow areas that look like land, and it can be overgrown or overhung by vegetation, making the spectral signal ambiguous. However, the shape of a river is unique, offering a characteristic that can be used to identify this landscape feature beyond color.

This is an example of one of the steps of object-based image analysis. The groupings are smooth and intuitive. Regions can be combined, such as the subdivisions of the fields. My classification (above), used a per-pixel approach, and resulted in a much more speckled, rough classification.
The biggest difference between pixel-based and object-based image analysis is that objects have spatial characteristics that can aid classification in addition to spectral information, such as the shape of a river. Other characteristics include scale, neighborhood, texture, and boundary relationships. These features are independent of any particularities of the cameras taking the images, so they are still useful in different types of light (noon vs. twilight) or across cameras with different calibration. Groups of pixels have other advantages over individual pixels, including statistics (measures of center, range, and spread, ratios) for each wavelength that is captured. Together, these advantages have made object-based image analysis the new paradigm in remote sensing image classification.
I’m hopeful that I will be able to get the results that I want with an object-based approach. I’ll share my maps when they’re ready!


