November in the Lab: Extractable nutrients, or what color is it?
One of my main questions is how much pollution plants remove from water in stormwater detention basins. In many areas, excess nutrients are actually pollutants. At low levels, phosphorus and nitrogen are essential nutrients for plants. At high levels, excess phosphorus and nitrogen allow a film of algae to grow on water, suffocating everything in the water.
In order to test how much phosphorus and nitrogen is in captured in the soil, I am testing samples I collected in the field this summer against samples with known concentrations of P and N. In the previous post (October in the lab!) I showed how I extract the solution that is analysed. Now let’s take a look at the process of analyzing the samples.
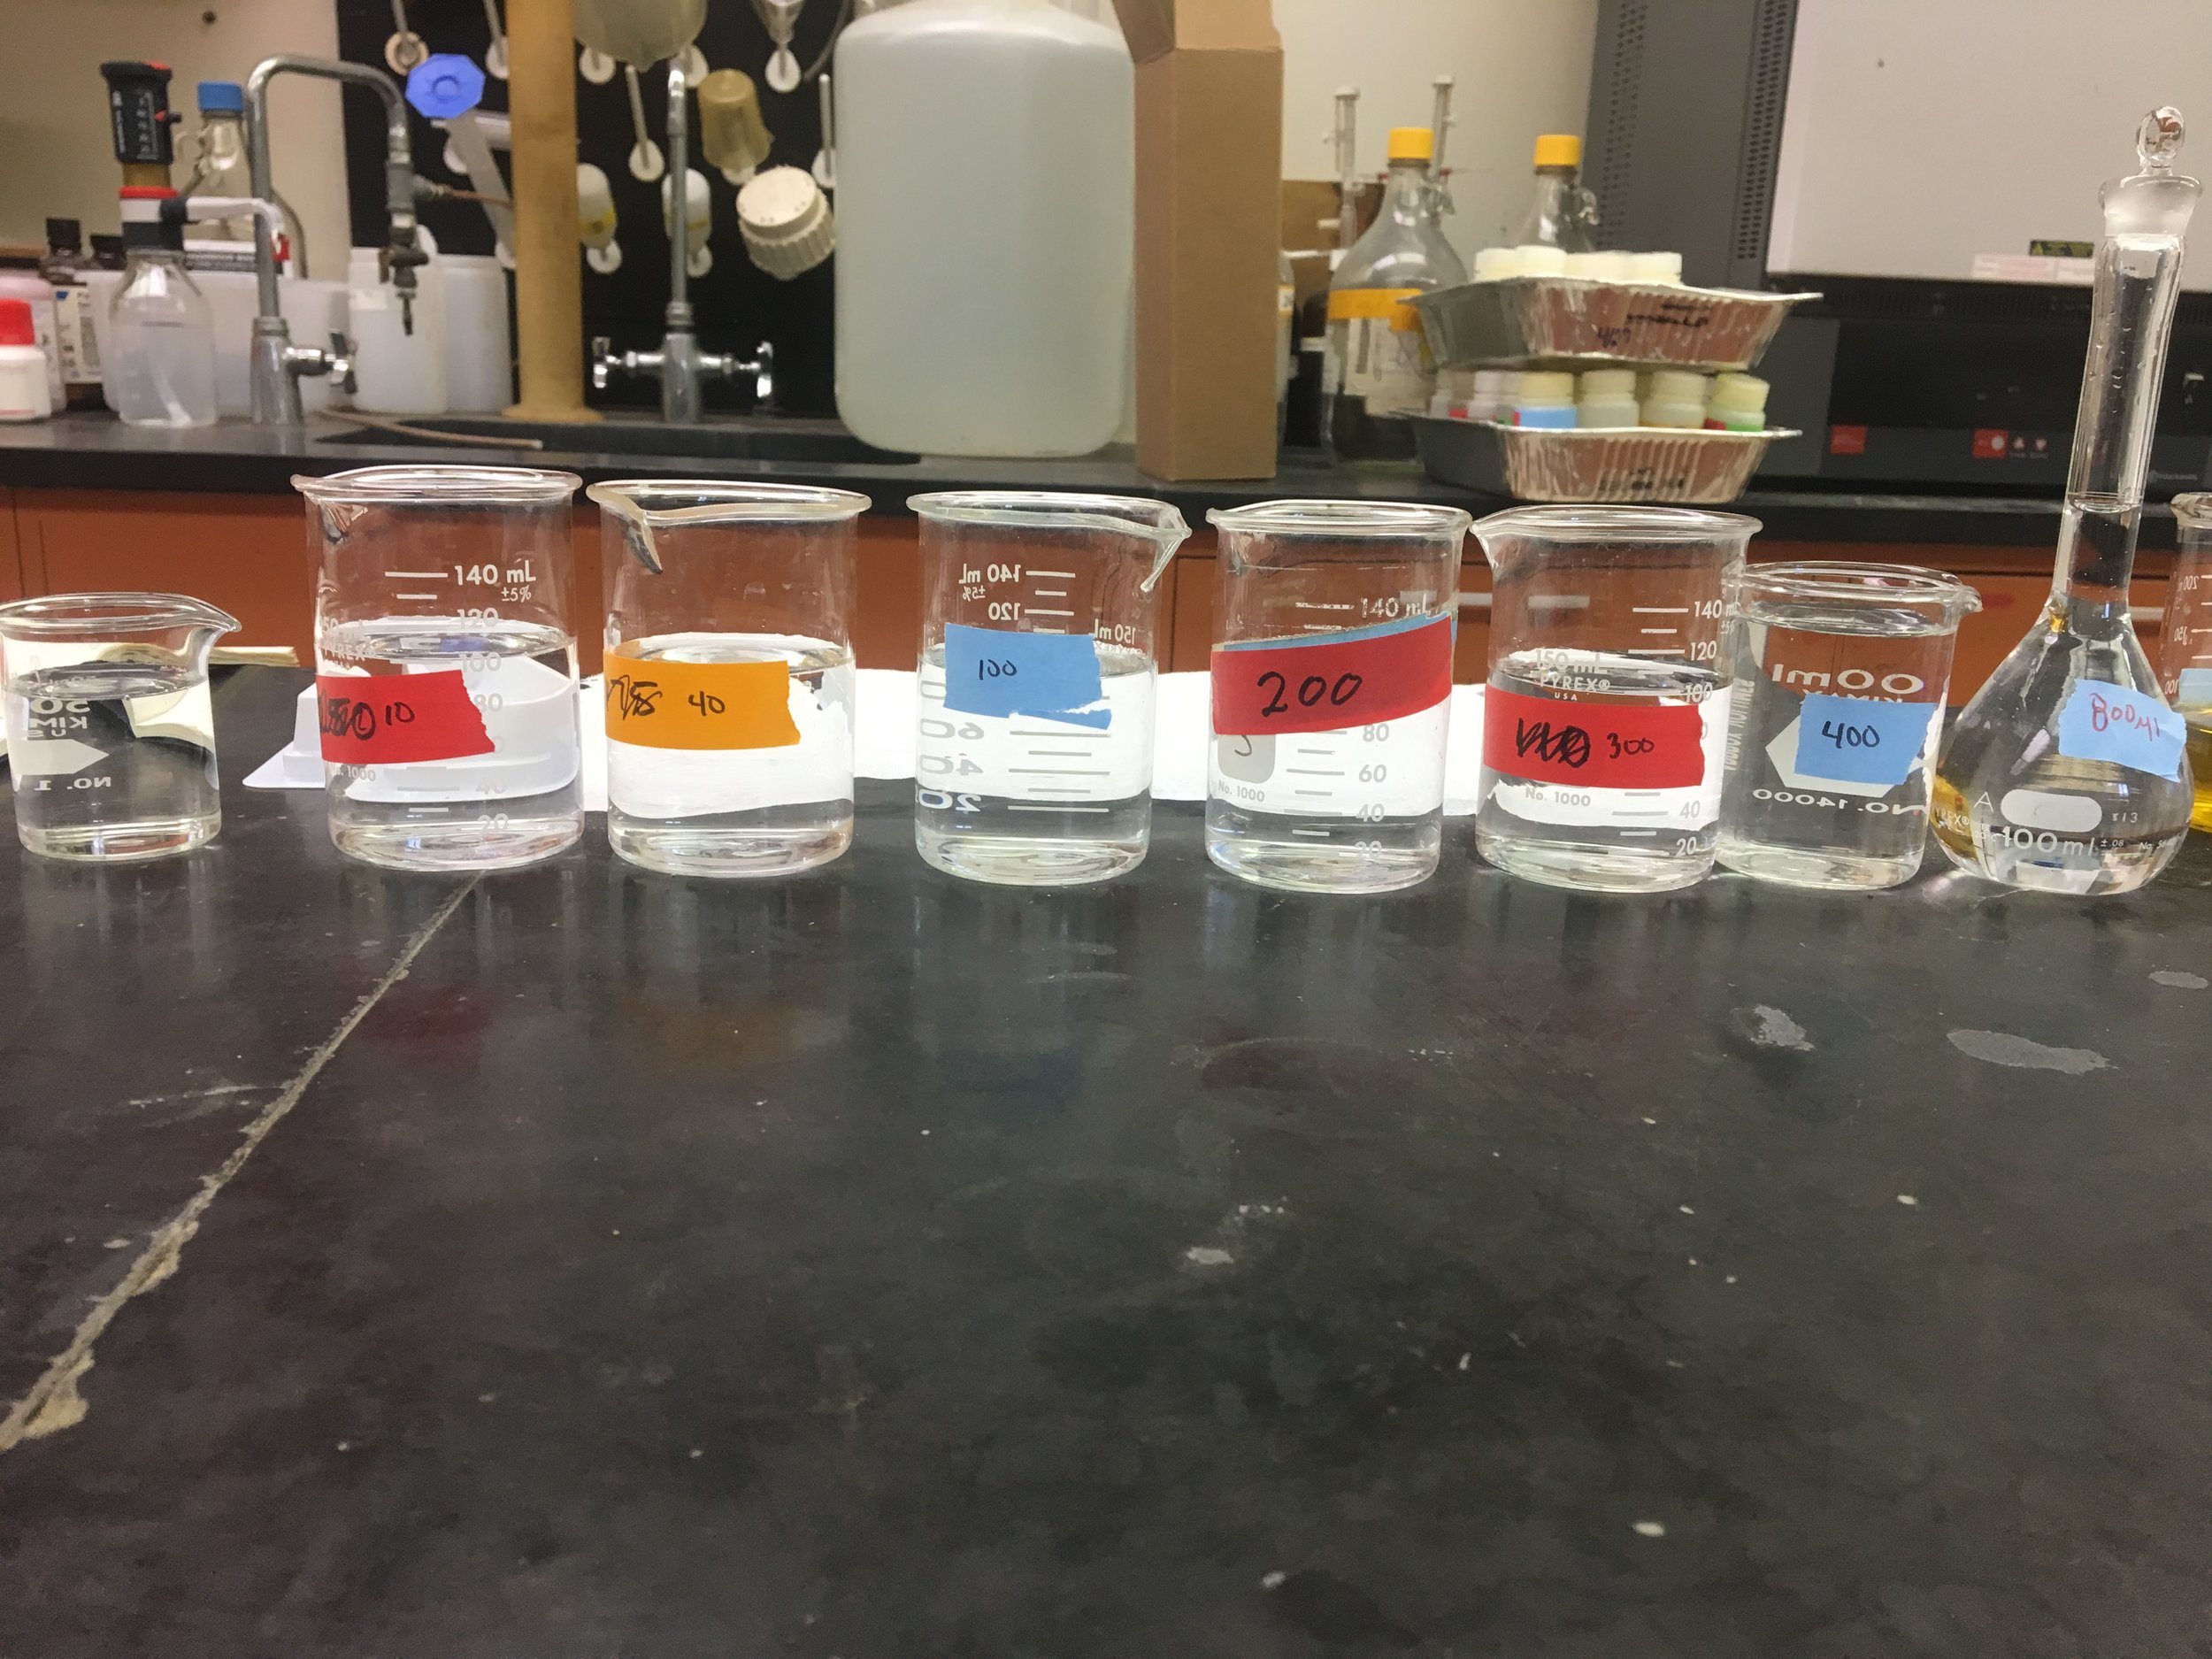
1) First, I make a series of solutions with a known amount of P or N. Each sample has a higher concentration of the element, and the concentration range goes from zero to above the level that is likely to be in the field samples. This is known as a serial dilution, and it creates the standard that I will use to test my samples with unknown concentrations of P and N. In the photo, the standard has 10, 40, 100, 200, 300, 400, and 800 microliters of N mixed with water.

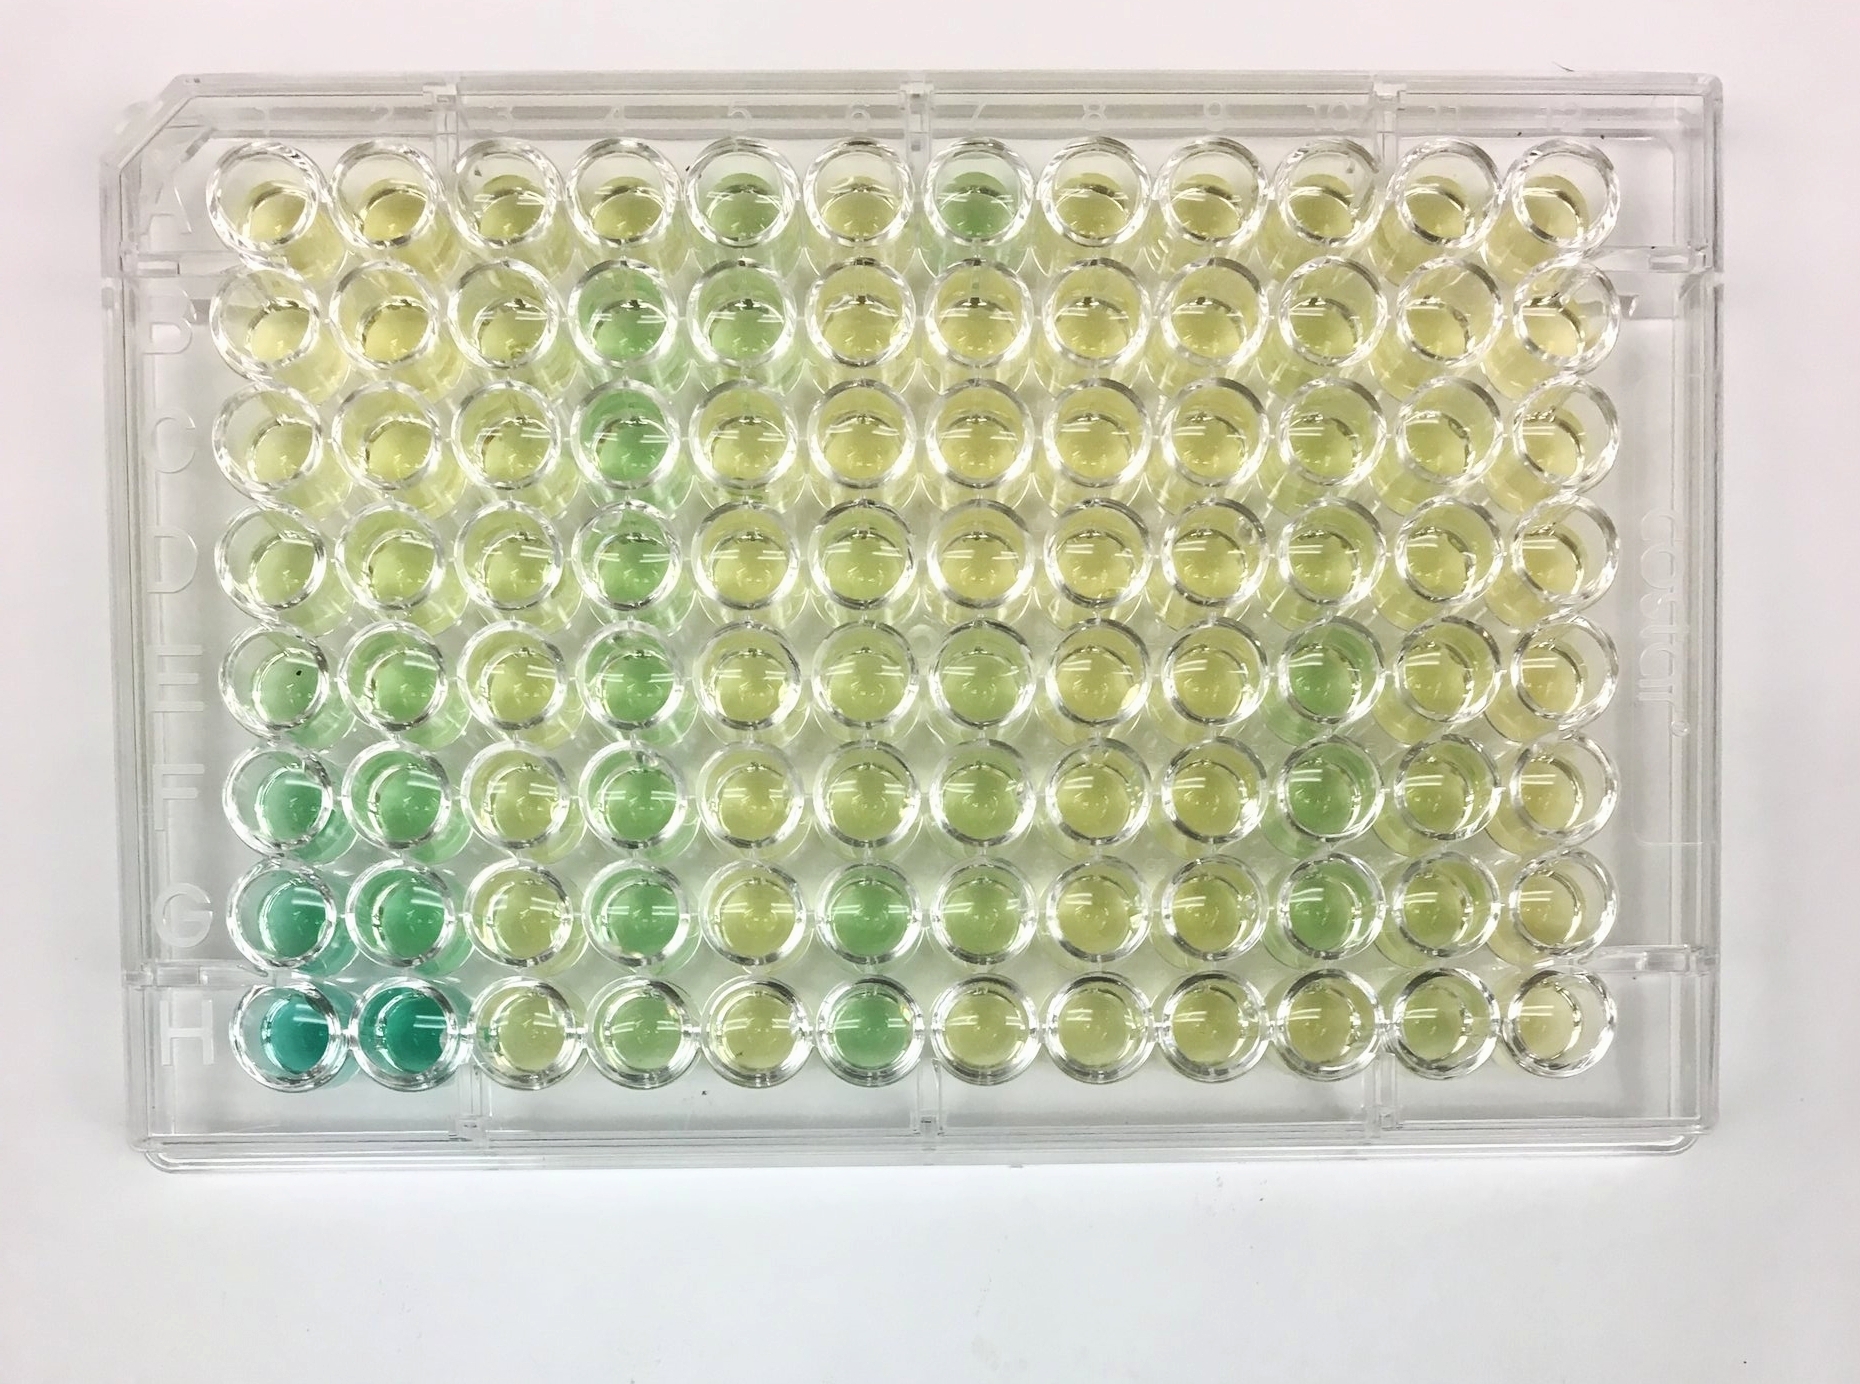
2) I pipette the serial dilution into the first two columns of the plate. The gradient from pale yellow, to pale green, to dark green shows the increasing concentration of the nitrogen. The rest of the plate, with varying colors, holds the samples from the field.
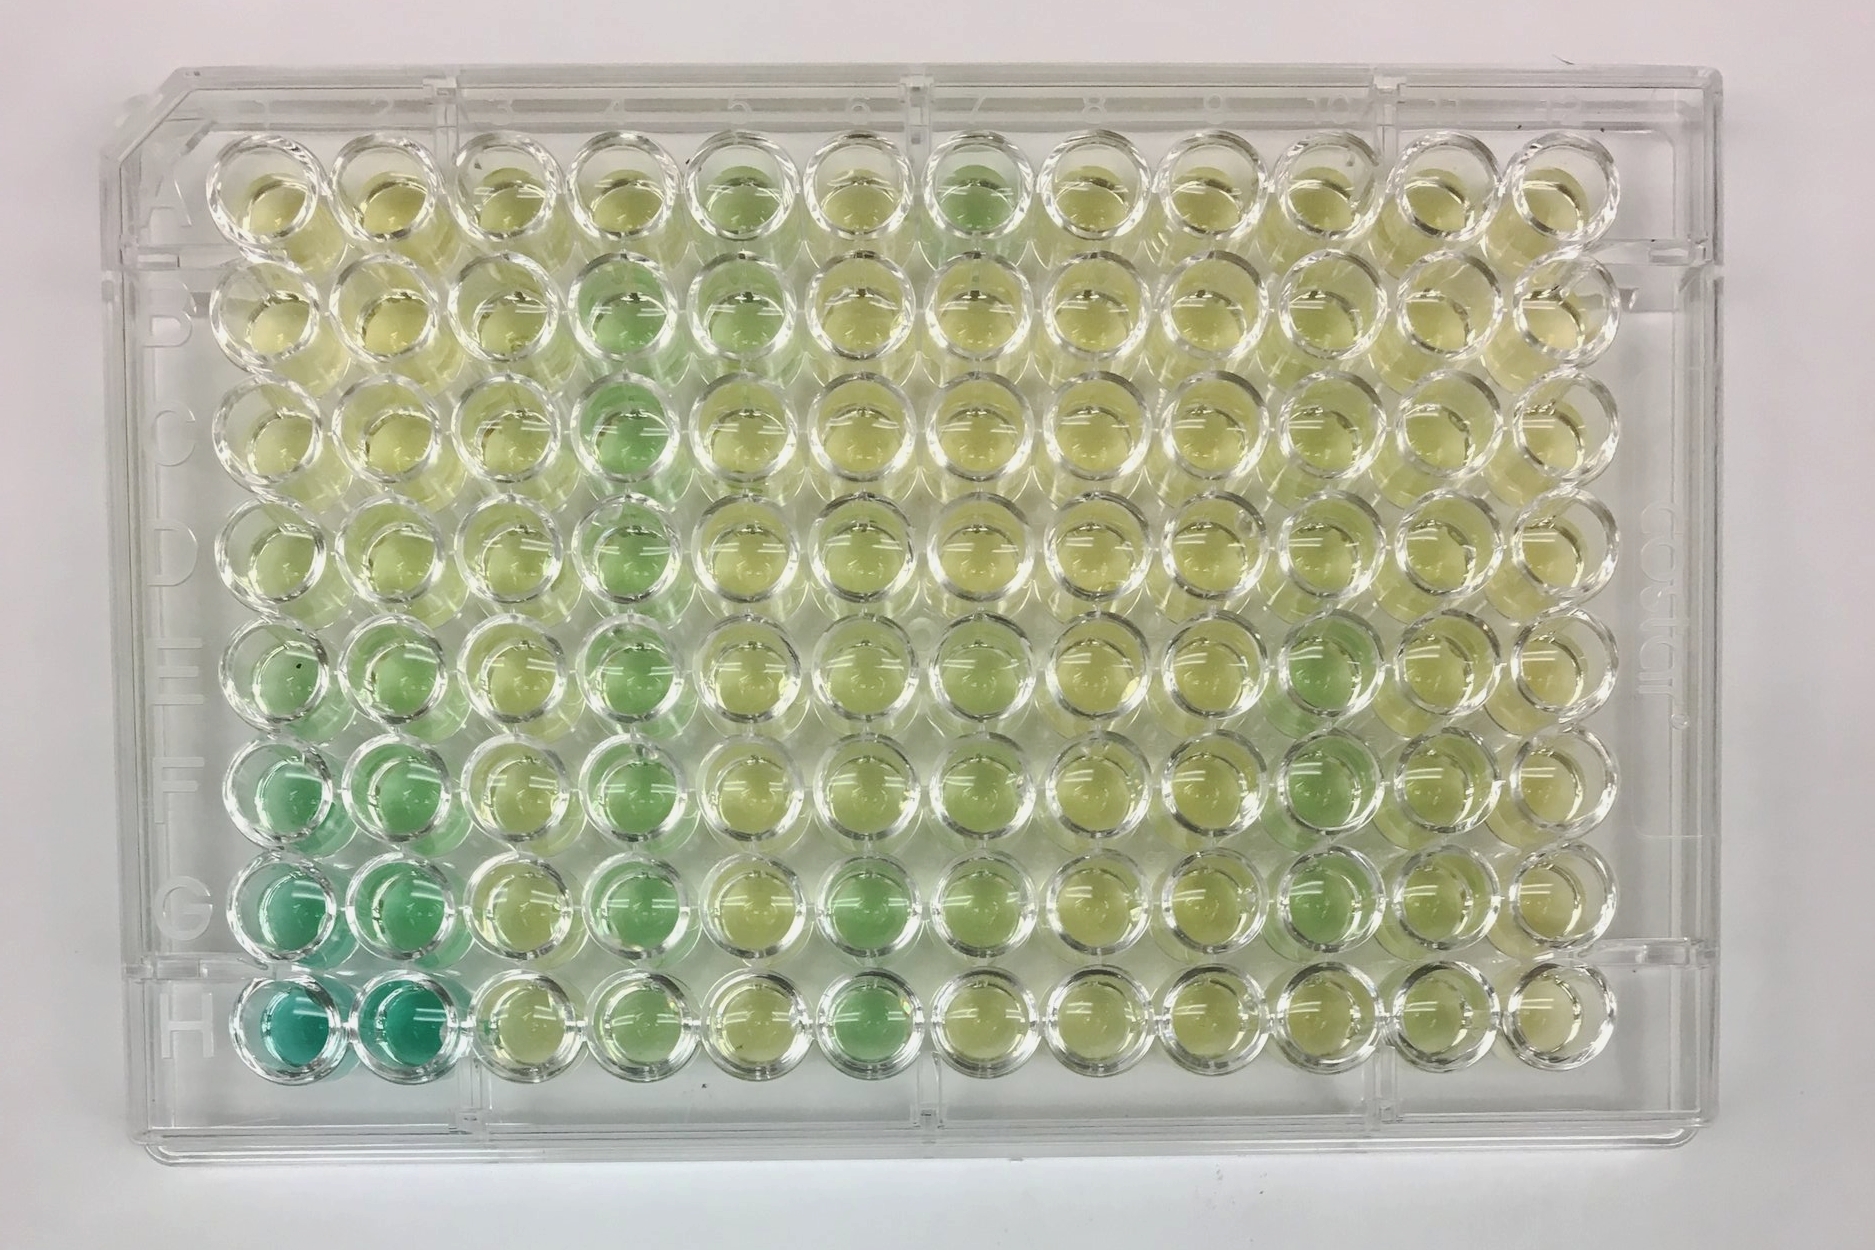
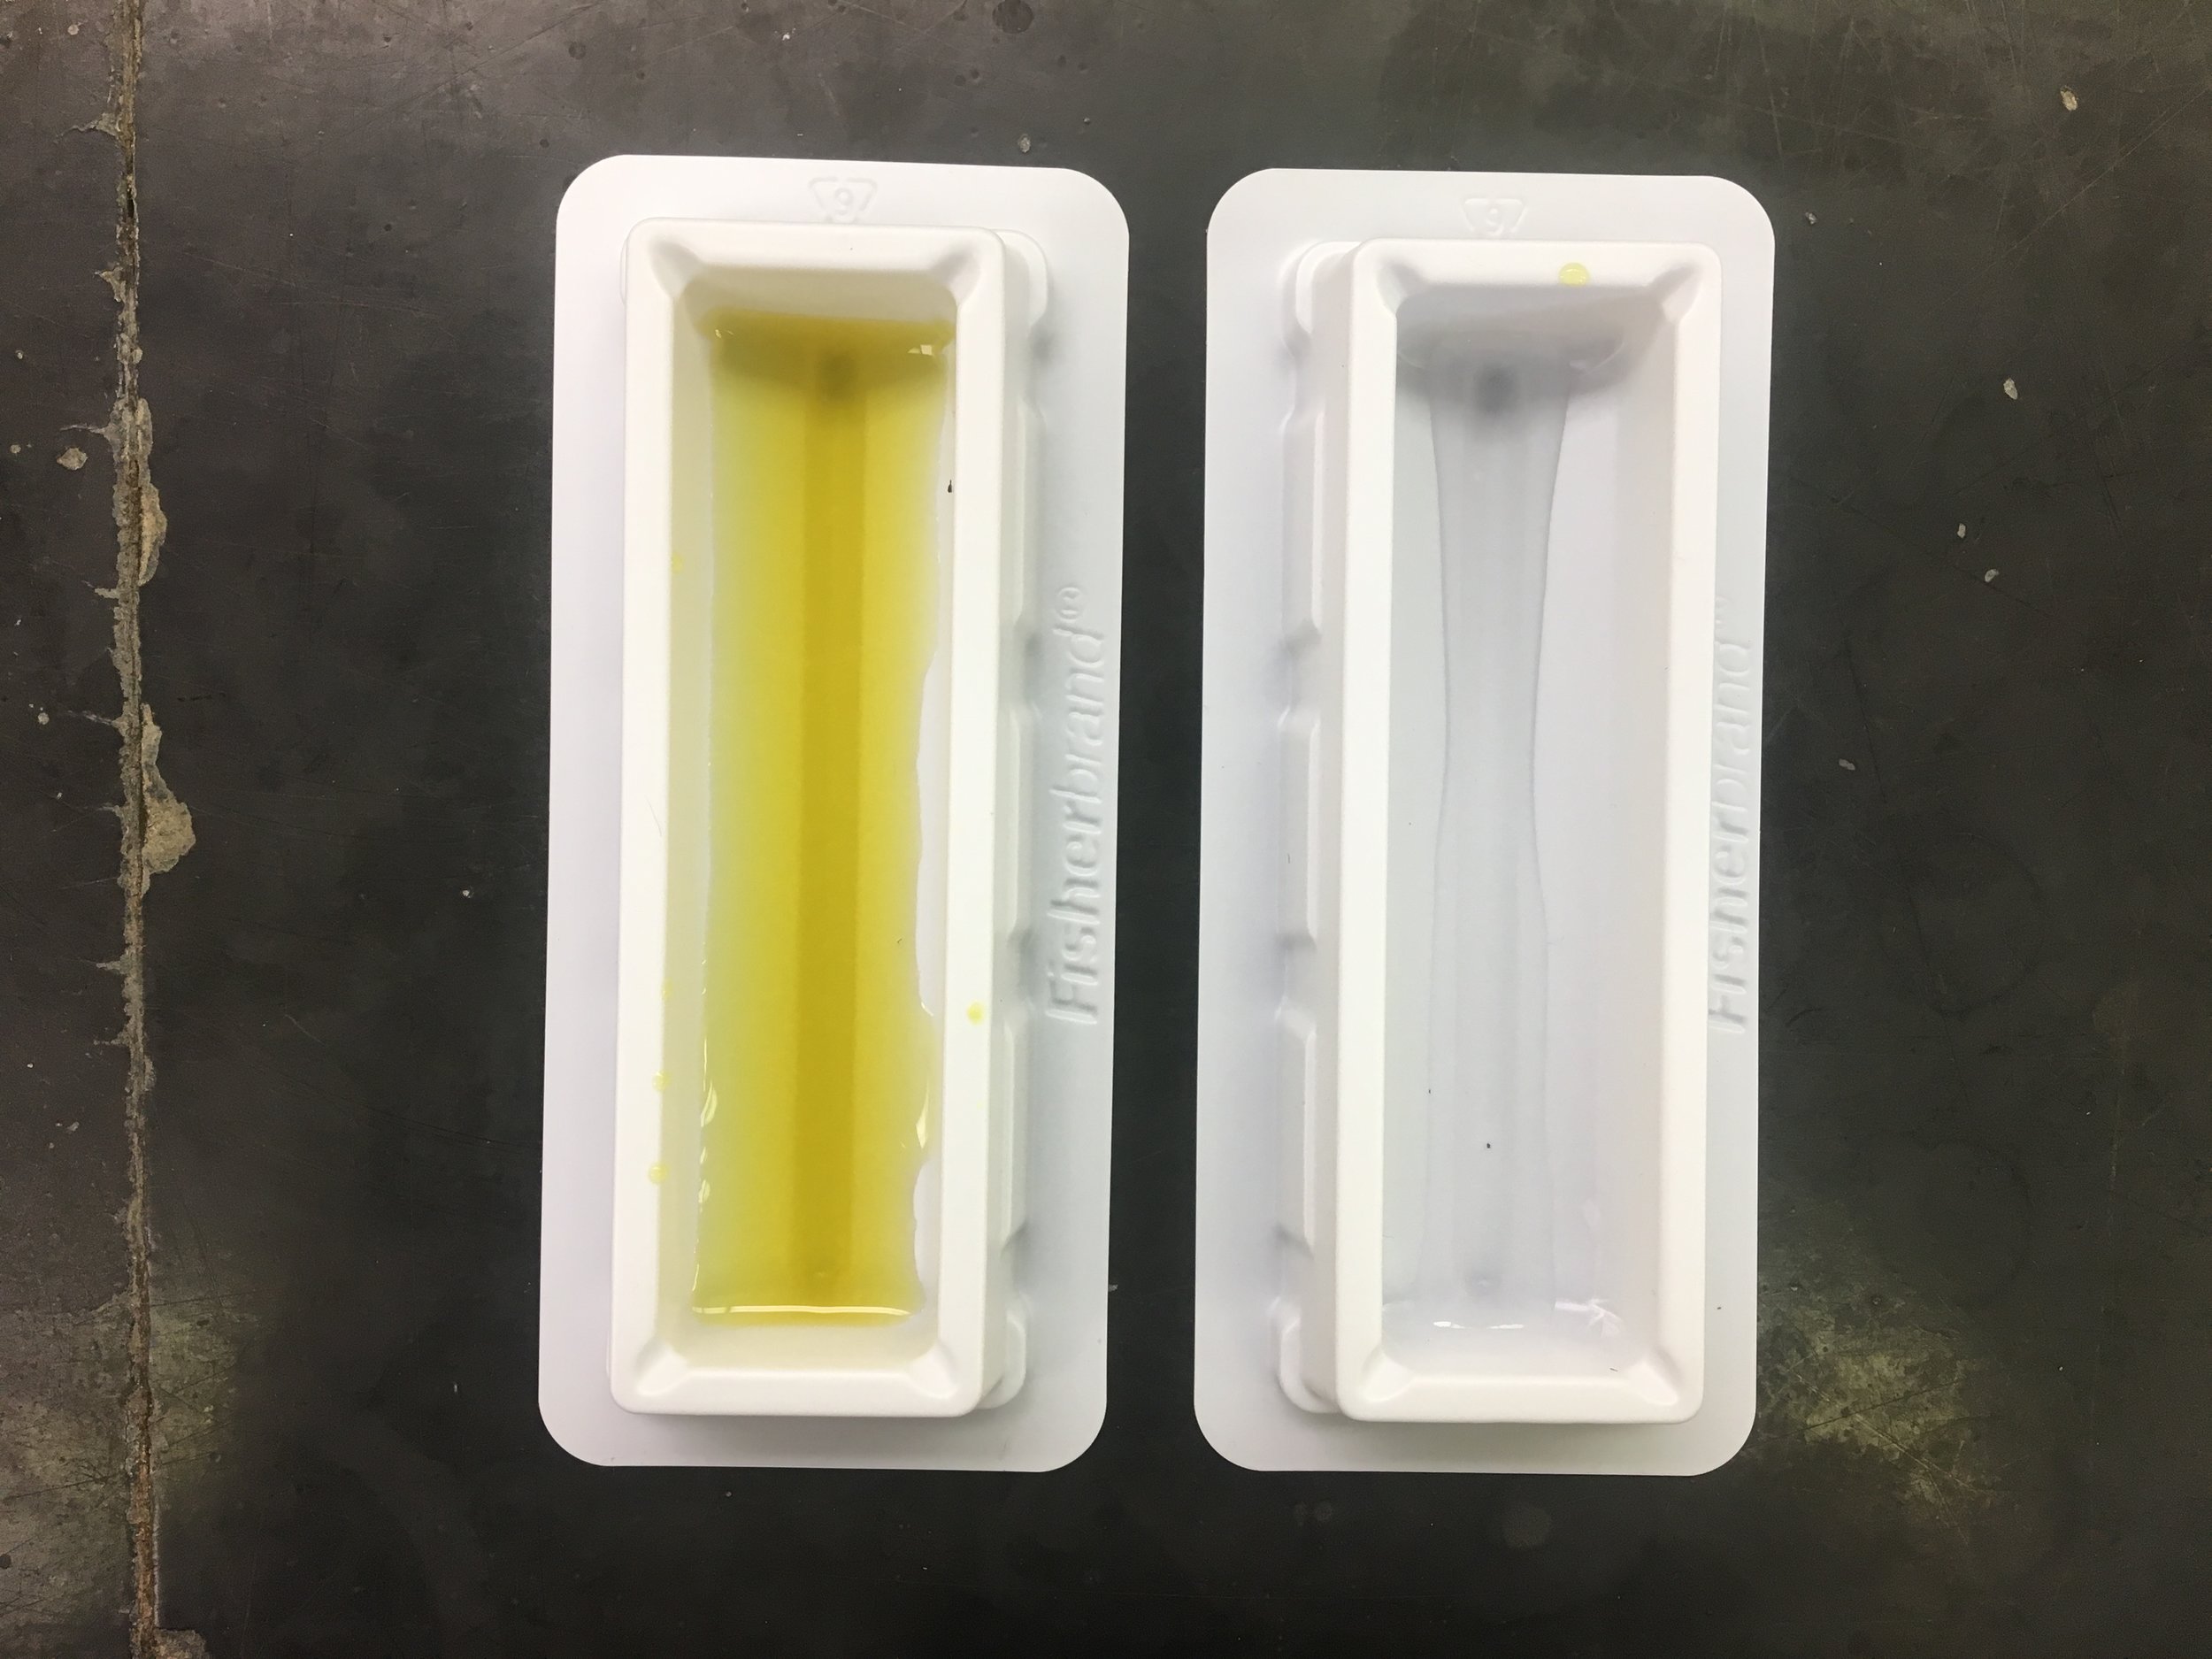
3) In order to get the colors, I add reagents to the samples to cause a reaction. In this ammonium-N reaction, there is a colorant and an oxidant that are involved. The reagents react with the nitrogen in the samples, and turn green. The darker the green, the more nitrogen is in the sample.

4) The plates are inserted into a spectrometer. The mechanism feels a bit like a VCR machine the way the plate is inserted and ejected. The spectrometer shoots a beam of green light through the colored samples and measures how much light passes through the sample and how much is absorbed. The more green light that is reflected, the greener the sample appears, which correlates with higher the concentration of N.
6) The spectrometer gives a reading of the light levels. In order to convert light reflection to nutrient concentration, we use the standards from step 1). Because I know the concentration of the standards in the first two columns, I use them to make a calibration curve (a real life use for algebra, and the formula y=mx +b!) for the unknown samples. Using the formula, I can convert the reflectance into concentration.

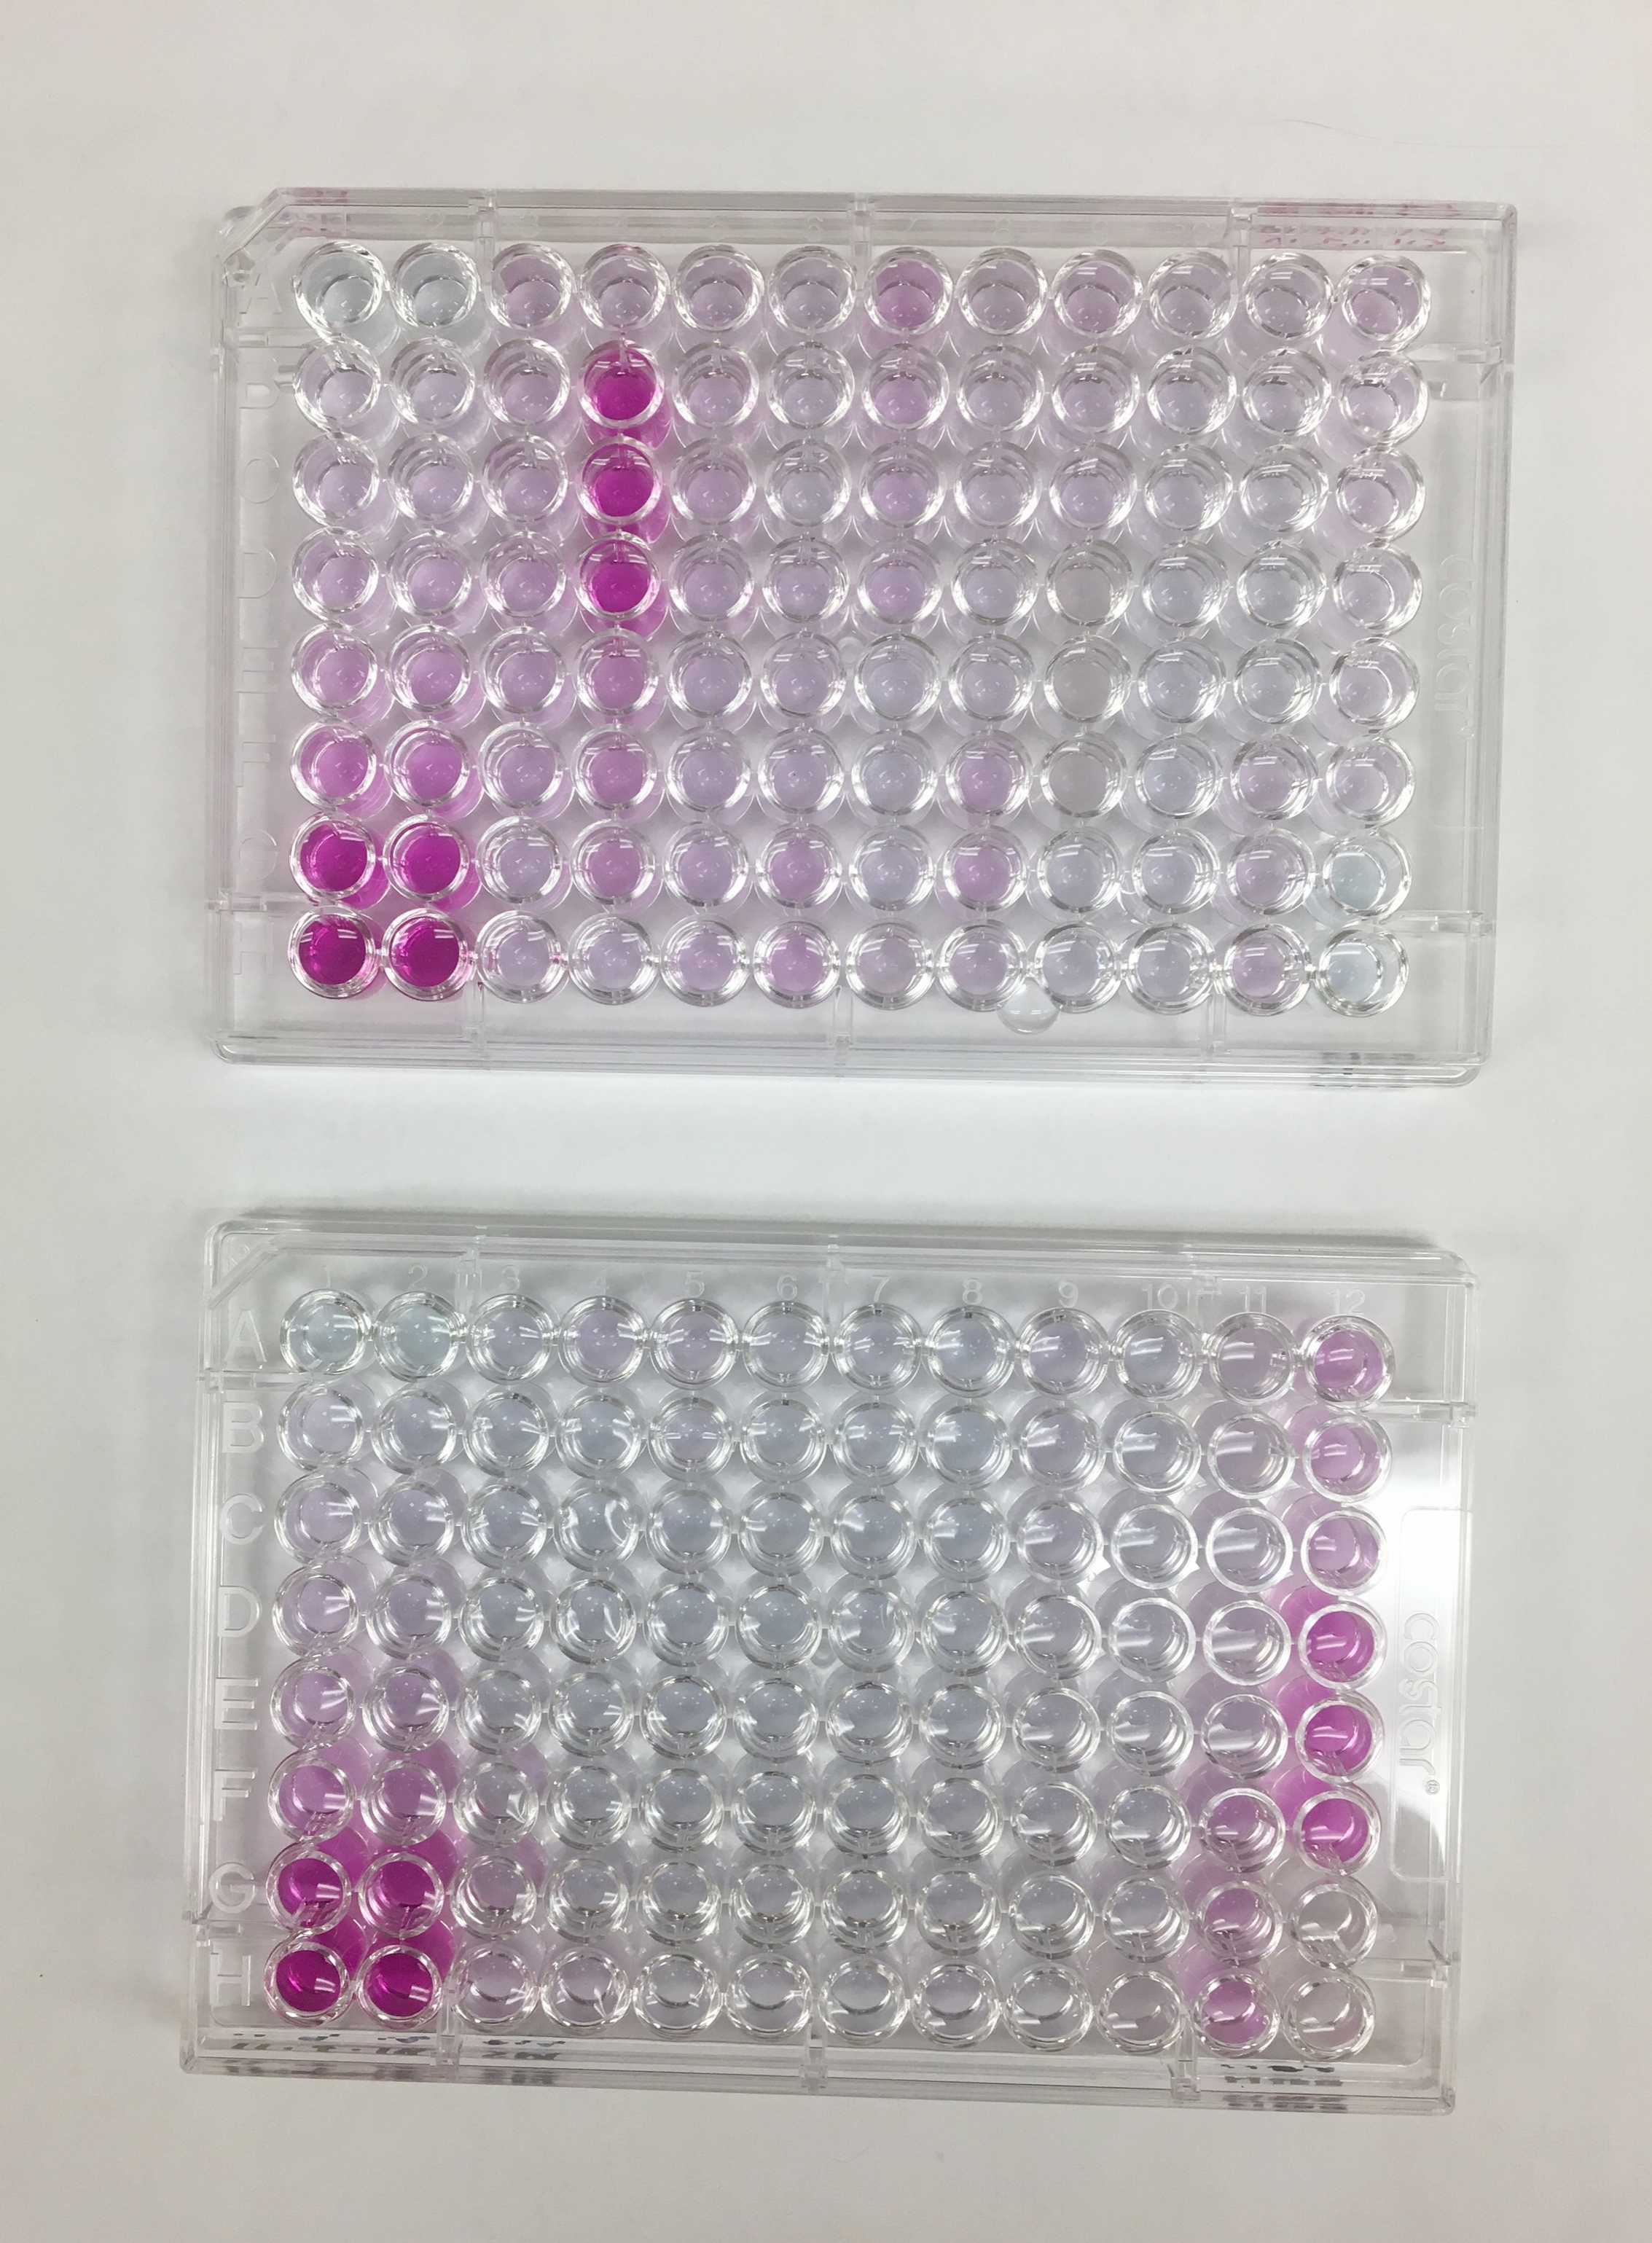
Below are all the steps: Serial dilution of standard, placing standard and samples into plate, adding reagents, reading the plate on a spectrometer, and finally converting light levels into concentrations. The two different colors in the plates are tests for different forms of nitrogen: ammonium and nitrate.